
Predicting the Holidays: Analyzing Competitor Holiday Trends
Originally written for SME attribution for Quad Analytix (now Wiser Inc.), a provider of actionable online and in-store data for retail decisionmaking.
-----
“Those who fail to learn from history are doomed to repeat it.” But the inverse can also be true: those who study the past can profit from it.
As the holiday shopping season begins, retailers large and small are looking to meet and surpass sales expectations for the year. E-commerce sales revenue for the 2016 holiday season is expected to reach almost $95 billion.
There’s no oracle that can tell you exactly how to attack the holiday season, or how to predict what your competitors will be doing, but looking at past behavior can be a great indicator. Armed with this knowledge, you can infer when your competitors will be launching their campaigns and plan your own accordingly, to maximize the ROI of your promotions.
Let’s take a look at a product category that is often the focus of holiday sales: women’s handbags. To predict how merchants in the category will behave this holiday season, we can look at the 2015 holiday season.
Wiser used our “Aggregate Product Discount Over Time” data to compare general discounting trends of similar retailers across a category.
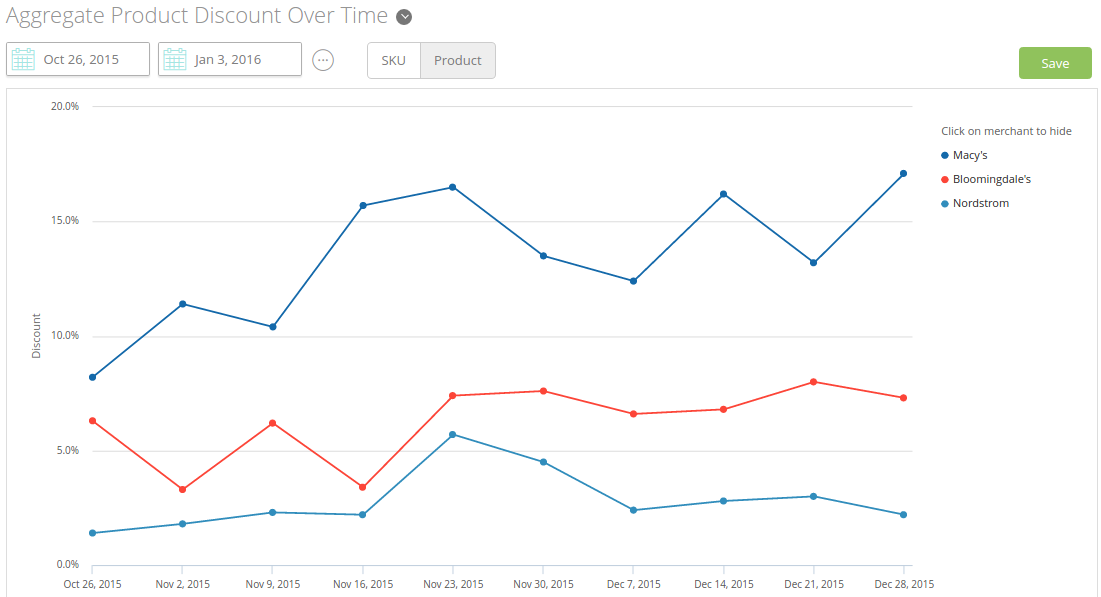
Here, we can see the average percentage of discounting for the women’s handbag category across Macy’s, Bloomingdale’s and Nordstrom for the 2015 holiday shopping season on a week-by-week basis. The week of November 23rd–the week leading up to the Thanksgiving holiday–sees a jump in discounts for all three retailers as they prepare for Black Friday and the kick-off to holiday shopping.
Let’s take a closer look at Macy’s prices for November 23, 2015. As we can see, across the category,
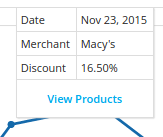
Macy’s average discount was 15.9%.
Doing the same for our other retailers yields their average discounts as well: 6% at Bloomingdales and 5% at Nordstrom. While there is no guarantee that these pricing strategies will be repeated for the 2016 holiday shopping season, you now have a view of what you might expect from these retailers in the coming weeks.
Let’s drop back even further to August 31, 2015–around the time we can expect Back to School sales to come to a close.
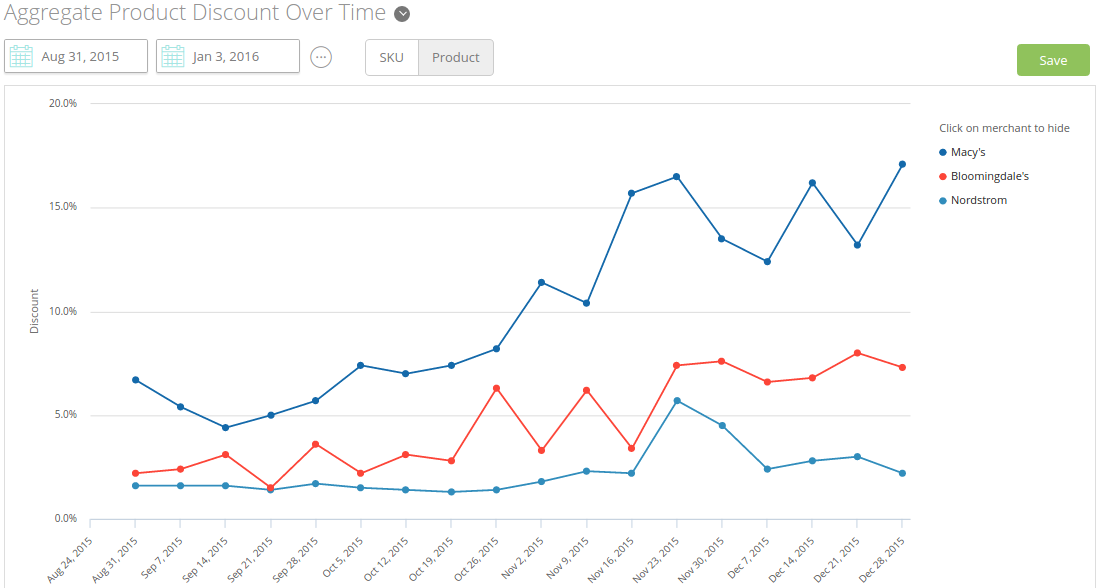
We can see that discounts drop or stay relatively static from early September through the beginning of November, just in time for holiday sales. Now let’s look at a similar date range for this year: August 29, 2016 through November 6, 2016.
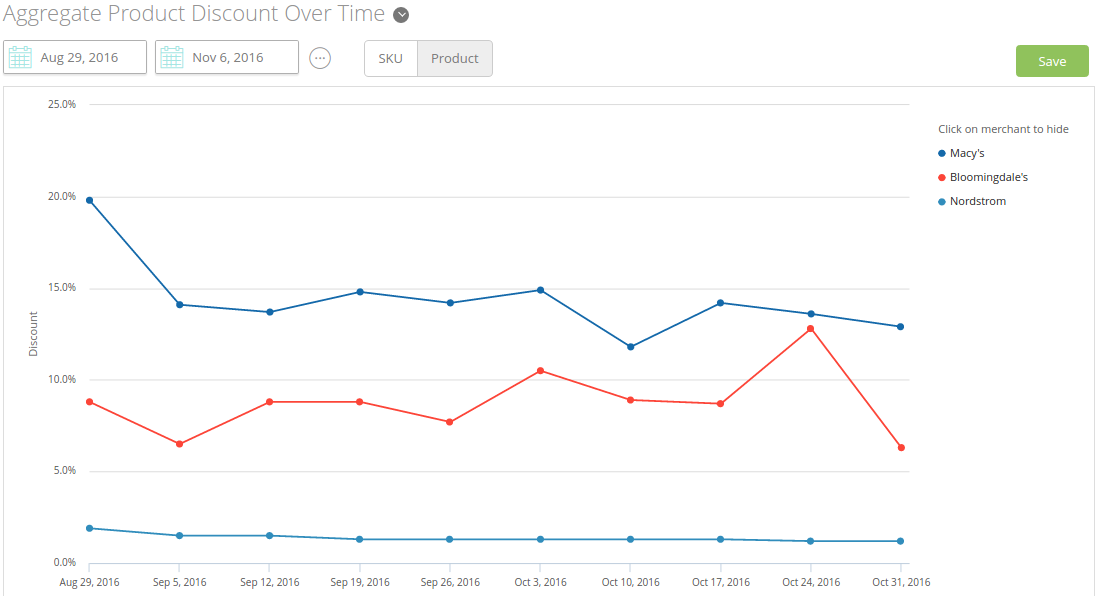
The same general trend holds true, though we can see that both Macy’s and Bloomingdale’s have maintained higher average discounts in 2016 than they did in 2015.
Other good indicators can be spotted by analyzing the “Discount Level for Discounted Products” metric. Here, we’ve drilled down to one retailer–Macy’s–and one brand with that retailer, COACH.
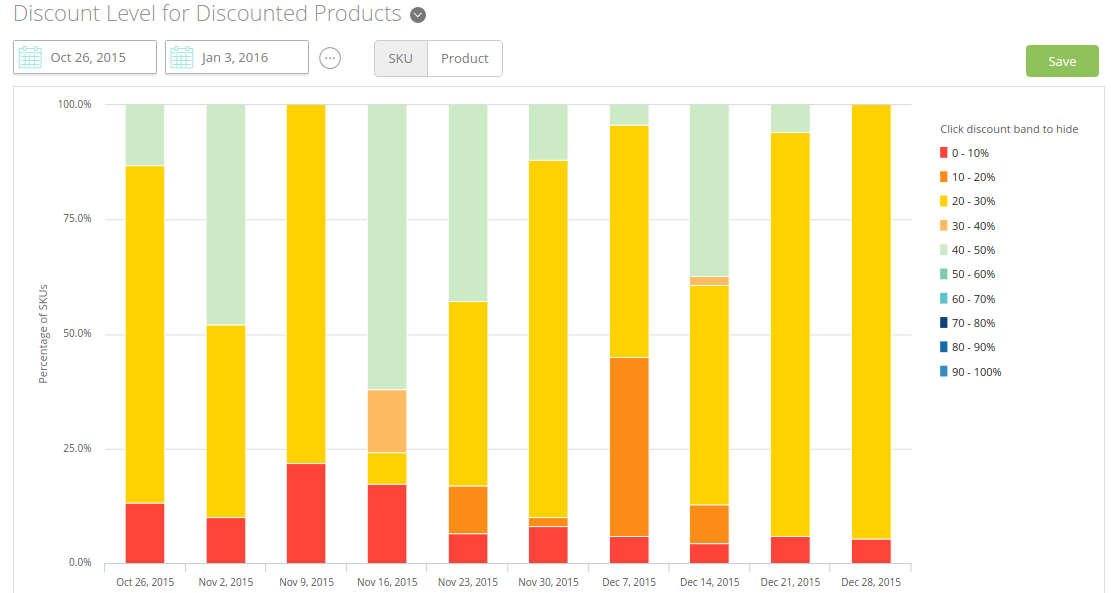
Looking at the 2015 holiday shopping season, we can see the distribution of discounts across the COACH brand, with larger discounts in the weeks leading up to Black Friday. We can use this to spot markdown patterns across the handbag category by comparing similar discounts between brands and retailers. This can help you better manage your pricing and discounting strategy by estimating demand for your products to make sure you are competitively priced this holiday season.
Beyond percent discounts, it’s also important to look at different types of promotions your competitors are running.
Here you can see the distribution of promotion types for the weeks leading up to Black Friday in 2015. Not only did the total number of promotions jump week over week (as expected), the types of promotions offered tended to diversify as well.
It’s also worth noting in all of the charts above that discounts and promotional pricing in 2015 started to rise earlier, in the first two weeks of November, instead of jumping straight to deep discounts on Black Friday. It’s too early to tell if the same will hold true for 2016, but media outlets have been making that claim for the past few years, and the data backs up that assertion.
By looking at both holiday pricing trends from last year and comparing overall pricing trends from 2015 and 2016 leading up to the holiday season, you can gain valuable insight into how you can expect your competitors to behave in the upcoming weeks and adjust your strategy accordingly to compete for those holiday dollars.
Post a comment